Module 6
[Mass family placement and colour by excel]
Mass family placement in Revit Dynamo can be a very useful tool and has been shown to work in many different situations. To explain how it works, I have chosen to demonstrate populating a stadium bowl in Revit with seats. As the position of these seats are usually predefined in Rhino/Grasshopper, I will also show how to import the XYZ coordinates needed from Grasshopper and colour the seats according to their C-Value. I have chosen this example as I am familiar with stadium bowls and find it useful but I’m sure you won’t have much trouble adapting this script to suit your needs. If you need any assistance in doing so, please don’t hesitate to ask.
If you want to play with the script including all it’s components, all the downloads are at the bottom of the page. Word of warning though, as the bowl was generated in Rhino using metre units, Revit needs to be set to the same units. Also, I’ve had a couple occasions when I run the script for the first time and it gets stuck in a never ending loop. The only reason I can think that this would occur is due to the Dynamo file size which is relatively large. I have found opening up the script in manual mode and replacing some of the nodes helps to fix the problem.


To start, we need to import the excel data which contains all the XYZs created in Grasshopper. Unfortunately I can’t share the grasshopper script as its sensitive information but all we need is a list of points which are generated in grasshopper that specify the location of each seat. These points are created based on their required C-Value which you can read more about here. So, to retrieve the excel file, we start by using the File Path node and File.FromPath node to get the excel file. With this file we can use the Excel.ReadFromFile node to get its contents along with the sheet name which is Sheet1.

The data coming in from the excel file is extracted as rows. So, we now have a list of sub-lists, each sub-list containing the X, Y and Z of a point. In order to change this to three sublists of all Xs, Ys and Zs, we need to use List.Transpose. What this does is interchange the rows and columns. If we have, for example, 20 sublists of 3 items, we will have 3 sublists of 20 items after transposing them, make sense?

We now have a list with three sublists containing the X,Y,Z values respectively. To recreate these points in Dynamo, we first get each of these sublists using List.GetItemAtIndex node and the indexes 0,1,2. We then use each of these lists to create the points with Point.ByCoordinates.

In order to get the C-Value and direction of the seats, we need the focus point for each seat which will be a point defined on the playing field. This is usually determined when the bowl is generated in grasshopper in the form of a curve. We need to import this curve to calculate direction of seats and C-Values so we use Select Model Elements to select the imported curves in Revit. We can then get the geometry of the curves in Dynamo by using Element.Geometry.

The geometry from Revit is broken up into several curves which need to form one polycurve. To do this, we first get the Curve.StartPoint and Curve.EndPoint of each curve. The last item of endpoints is obtained using List.LastItem as this will be the end point of the new polycurve. Therefore, the start points and one end point are joined using List.Create which is then flattened with Flatten so there are no sublists and these points are input into PolyCurve.ByPoints to make one polycurve.

We now have a list of XYZ points for seat placement and a curve which defines their focus. Here we use Geometry.ClosestPointTo to determine which seat is closes to the focus curve. This will later be used to determine how far to rotate the placed seats. The image below demonstrates how the points for the seats and closest points on geometry should appear.


To find the angle to which we will rotate the seats later, we first create new points with Point.ByCoordinates with 0 for the Z-value and the X,Y values we obtained in part 3 so they are on a XY plane. We then move or translate these points with Geometry.Translate in their Y axis by -5 units.

With the new and translated points in part 7, we can now create a vector with these using Vector.ByTwoPoints. Using this same node, we can create another vector using the new points from part 7 and the closest point on curve obtained in part 6. With these two vectors we can then use Vector.AngleWithVector to find the angle that the seats need to be rotated. The image below demonstrates how this will work.


After we have calculated the seat rotations, we also need to find the C-Value for each seat. To do this, we need the distance from each person’s eye to focus point, the height of each person’s eye level and the height of each riser of the stadium bowl. To get the distance to each person’s eye from focus point, we can use the same XY points created in part 7 and the closest points on curve from part 6 to create a line using Line.ByStartPointEndPoint. We can then get the length of these lines with Curve.Length. These lengths are then reversed with List.Reverse so they are listed from the back row down and 0.400 is added to each item with the addition(+) node. This is added to each item so we take the distance from eye, not the front of seat. We now have the distance to each seated persons eye to the focus point.

To get the eye heights and riser heights, all we need are the Z values of the points created in part 5. We get these with the Point.Z node and these values are reversed with the List.Reverse node.

1.2 is added to the reversed values from part 10 with the addition (+) node. The result of this will be the height of each person’s eye from ground. Now all we need is the riser heights. To get these we can use a Python Script to start the process. This script starts from the back row and calculates each height of the riser below which is why we reversed the list in part 10. This works well for all rows except the from row which will need to be added to the output. The details of this Python Script are explained in part 11.1.

In order to get the heights of the bottom risers, we first Count the number of items from the Point.Z output in part 10 and subtract (–) from this the Count of items coming from the Python Script from part 11. This will give us the number of items missing from the Python Script.

The List.Slice node lets us get a sub-list of items from a specified list. With the known number of items missing from the Python Script, we can use List.Slice to get the amount of items missing from the original Point.Z values which, should be the heights of all the lowest points. The start will be 0 and end will be the number of items missing. The result of this node is joined to the output of the Python Script using the List.Join node. We now have a list of all the riser heights from the top row down.

With all the information needed to calculate the C-values, we use another Python Script to do the calculations. The details of this are shown in part 14.1. The image below demonstrates the C-Values with a line from each eye point to a focus point on the imported curve.


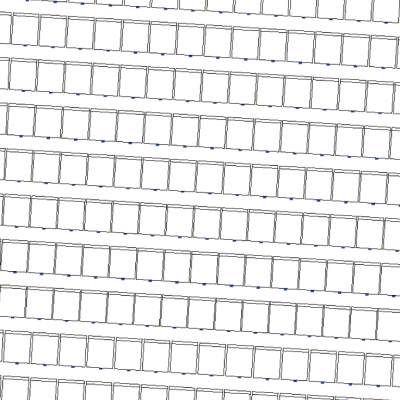
It’s now time to actually place the seats. To do this, we first select the seat family type with the Family Types node and feed it into the FamilyInstance.ByPoint node which is used to create the families. The point input for this node are the first points created in part 5. The result of this node is demonstrated in the image below.


The families are now placed and need to be rotated to face the focus line selected from Revit. The FamilyInstance.SetRotation does this using the families created in part 15 and the angles calculated in part 8. The result of this node is demonstrated in the image below. We then reverse these families with the List.Reverse node which means we have a list of all families placed from the back row down.

The C-Values calculated in part 14 are now used to colour the seats according to their value. First the multiply (*) node is used to convert the metre units to millimetres. This isn’t essential, I’m just used to using C-Values in this unit. These values are then fed into a Code Block node which determines which values relate to what colour. Here we use the Design Script language to check a series of if/else statements. You can read up on the Design Script syntax here. Using the colon ( : ) symbol, we can add as many statements as we like and if none of them are true, then the final statement is output, Color.ByARGB(255,255,0,255) in this case. The options here are only for three colours to keep things simple. So If the C-Value is between 100-115 : output colour Green ,if the value is between 115-120 : output colour Cyan, if neither of these, output colour magenta. I have kept this very simple for presentation sake, I’m sure you could make a much nicer colour gradient if needed. The output of this node will be a colour for each point which relates to it’s C-Value.

With the rotated families and the list of colours, we can finally use the Element.OverrideColorInView to colour each seat accordingly.


This is a simple script to calculate the risers starting from the top row. It doesn’t require any modules to be imported so all we do here is set the values coming in to ZValues and declare the empty list lst. We then start a loop through ZValues using the enumerate function. What this does is associate the index with each value in the loop. So, the index will be i and the value will be val.

For each item in the ZValues list, we need to create a slice of the list starting from the index (i) until the end of list. This basically copies the ZValues list as a sublist which contains only the items from the index onwards.
Another For loop is created to cycle through each item in the new list. If the item (j) is less than the current value (val) then the difference between the two is appended to lst. What this is doing is checking if there is a lower value and if so, add the riser height to the list. Therefore, we should have a list of risers as the output excluding the lowest values as they will not have a lower value to subtract and append.


The inputs for this python script are the distance to eyes (eyeDist), the height of each riser (riseHeight) and the height to each eye (eyeHeight). An empty list is created and set to the variable lst.
With all these inputs, we create a For loop to cycle through each list simultaneously using the zip function. The varables D, N and R are used as the variable for each item, in each list.

For each loop through the lists, we calculate the C-Value with the formula shown. This is a standard formula which is explained here. The value 0.840 is the seat width plus the aisle width. I have input this manually as it can change depending on how the bowl is generated. The result of this calculation is appended to the lst which is the output (OUT).
The result of this script will be a series of coloured seats according to their C-Value facing the focus point as they should be, as shown below. I have only used a small section of a lower stadium bowl for this example but you can imagine how it would work for the whole bowl. I’m sure this script can be adapted for many other uses which I would love to hear about if you do some experimenting.
If there is anything that does not make sense or work for you, please let me know and I will be happy to help out. The download files are below so feel free to give them a whirl. If you need to contact me, please leave a message below, contact me via the About page or tweet me @LearnDynamo. There will be many more modules coming up soon too so please subscribe below to get them first.

June 22, 2016 @ 1:00 pm
This is really good, can you create a camera view for a seat or seats to a specified point?
June 22, 2016 @ 2:04 pm
Hey Jason,
Thanks mate, glad you enjoy. I think you could create views based on the eye points and direct them towards the focus point. The problem will be the quantity as Dynamo would struggle to create a lot of 3d Views at once. It might work to set up a few views for each bay though at critical points. Give me a shout if you need a hand doing it.
July 11, 2019 @ 8:35 am
Hi Jermey,
could we use the same method to place columns or foundations
thanx
Ali
November 8, 2024 @ 2:53 pm
aa81sr